
Official data security incidents, Oct-Dec 2023
Quarterly stats on cyber and non-cyber incidents that have been reported to the Information Commissioner's Office (ICO). Education is yet again the top sector for data security incidents (15.6%). Get the facts and see the trends.

Key statistics from the Green Buildings Guide 2024
Key statistics from our guide 'Achieving green, healthy & cyber secure buildings'. See the numbers, including the growth of LEED, BREEAM or WELL accreditation, the tenant's view of green certificates and the rise in cyber attacks on buildings.
Official data security incidents, Jul-Sep 2023
Quarterly stats on cyber and non-cyber incidents that have been reported to the Information Commissioner's Office (ICO). Unauthorised access was the most common type of security incident (14.1%). Get the facts and see the trends.
Official data security incidents, Apr-Jun 2023
Quarterly stats on cyber and non-cyber incidents reported to the Information Commissioner's Office (ICO). Education was the top sector for data security incidents (15.9%). Get the facts and see the trends.
Official data security incidents, Jan-Mar 2023
Quarterly stats on cyber and non-cyber incidents that have been reported to the Information Commissioner's Office (ICO). Get the facts and see the trends.
Official data security incidents, Oct-Dec 2022
Quarterly stats on cyber and non-cyber incidents that have been reported to the Information Commissioner's Office (ICO). Get the facts and see the trends.
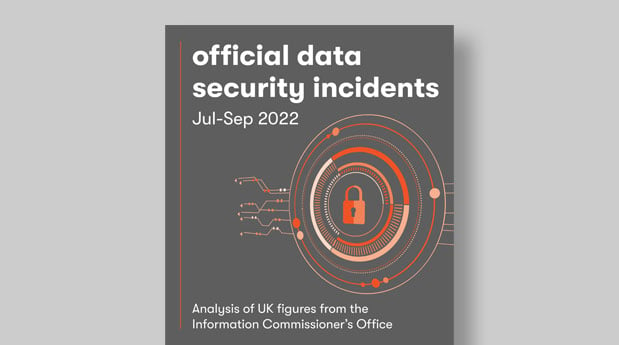
Official data security incidents, Jul-Sep 2022
Quarterly stats on cyber and non-cyber incidents that have been reported to the Information Commissioner's Office (ICO). Get the facts and see the trends.
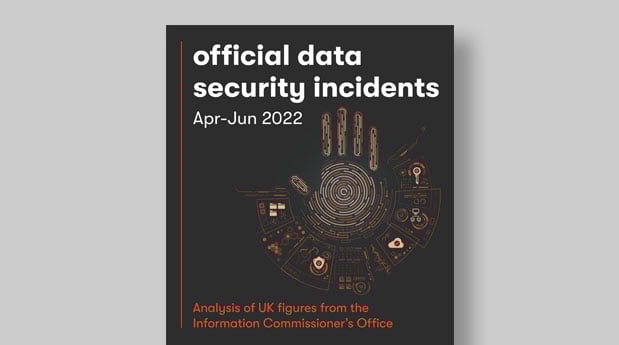
Official data security incidents, Apr-Jun 2022
Quarterly stats on cyber and non-cyber incidents that have been reported to the Information Commissioner's Office (ICO). Get the facts and see the trends.
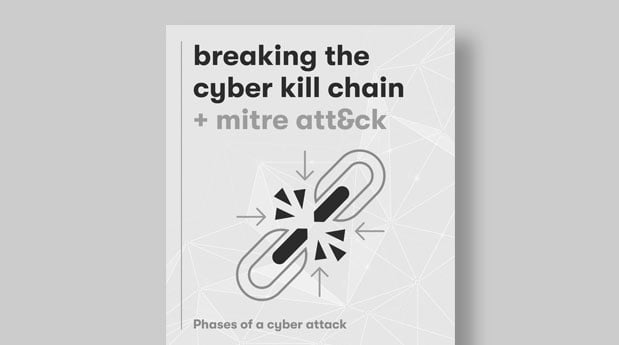
Breaking the cyber kill chain + mitre att&ck
A visual explanation of the Cyber Kill Chain and Mitre Att&ck. Shows the key phases of a cyber attack and how the two frameworks interconnect.
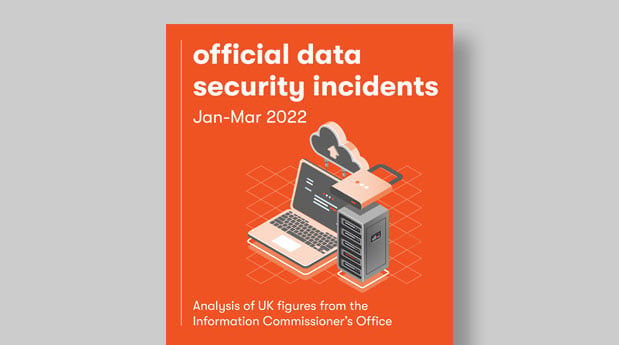
Official data security incidents, Jan-Mar 2022
Quarterly stats on cyber and non-cyber incidents that have been reported to the Information Commissioner's Office (ICO). Get the facts and see the trends.
contact our team of experts
Whether you're looking to get a project off the ground, need some technical advice or simply want to discuss the way we do things, we're always up for a chat.

